Covid-19 discussion, continued...

friendfromlowry Senior Member
7,778 posts 86 reps Joined Nov 2009
Fri, Dec 4, 2020 10:48 PM
posted by jmog

For the 3rd time, compare mask wearing now to last March/April. Mask wearing is WAY up and yet the spread is worse.


Things are also vastly different now than 8 months ago. Schools/colleges are back in session, at least more than they were. Sports are going on. People are back working in offices, going out to eat or drink. Families are getting together. None of that was happening in April. I feel like there was a general group effort back then to hunker down and stay safe. Now you read the comments on the local news Facebook or DeWine’s Twitter and people are fed up and don’t want to listen. 

And I’m not saying masks are the solution to it all. I, like most everyone else here, figure they can help to some degree, so what’s the big deal. I don’t understand how you can simply conclude they aren’t working because cases are up now vs then while ignoring everything else at play. 

Also, is there a link on the 93-95% compliance I can read for myself? Not saying I don’t believe you guys (except Spock) but I’d like to read it myself rather than take your word on it. Also, before you provide said link, are we following everyone around the entire time every day making sure they’re wearing a clean mask around their nose/mouth, not touching the mask or their face, washing their hands before and after taking the mask on and off? If they aren’t, then they aren’t doing it right in the first place.

queencitybuckeye Senior Member
8,068 posts 120 reps Joined Nov 2009
Fri, Dec 4, 2020 11:06 PM

The mask usage where the spread is happening is not 95%, not 9%. It's private get-togethers, mask usage effectively 0%.

Al Bundy Senior Member
4,526 posts 40 reps Joined Nov 2009
Fri, Dec 4, 2020 11:22 PM
posted by jmog

Current evidence says other wise.  95% mask compliance and it is spreading as bad or worse than the first wave back in April when no one wore masks.


It is spreading more because there are more cases. Masks reduce the chance of individual spread dramatically, but there are many more interactions with infected people. For example, 1% of 10000 is more than 5% of 1000. 

kizer permanente Senior Member
1,309 posts 18 reps Joined Aug 2017
Fri, Dec 4, 2020 11:29 PM
posted by jmog

For the 3rd time, compare mask wearing now to last March/April. Mask wearing is WAY up and yet the spread is worse.


People are also indoors with each other a lot more. People are back in schools. People are playing sports. People are back to work in person. People are eating and drinking in public..... the list goes on and on. There’s way more chances of exposure now then in March. The two are not comparable in any sense.  It’s a terrible take man. 


Al Bundy Senior Member
4,526 posts 40 reps Joined Nov 2009
Fri, Dec 4, 2020 11:49 PM
posted by jmog


If you believe it’s exponential then you truly have no idea what you are talking about.


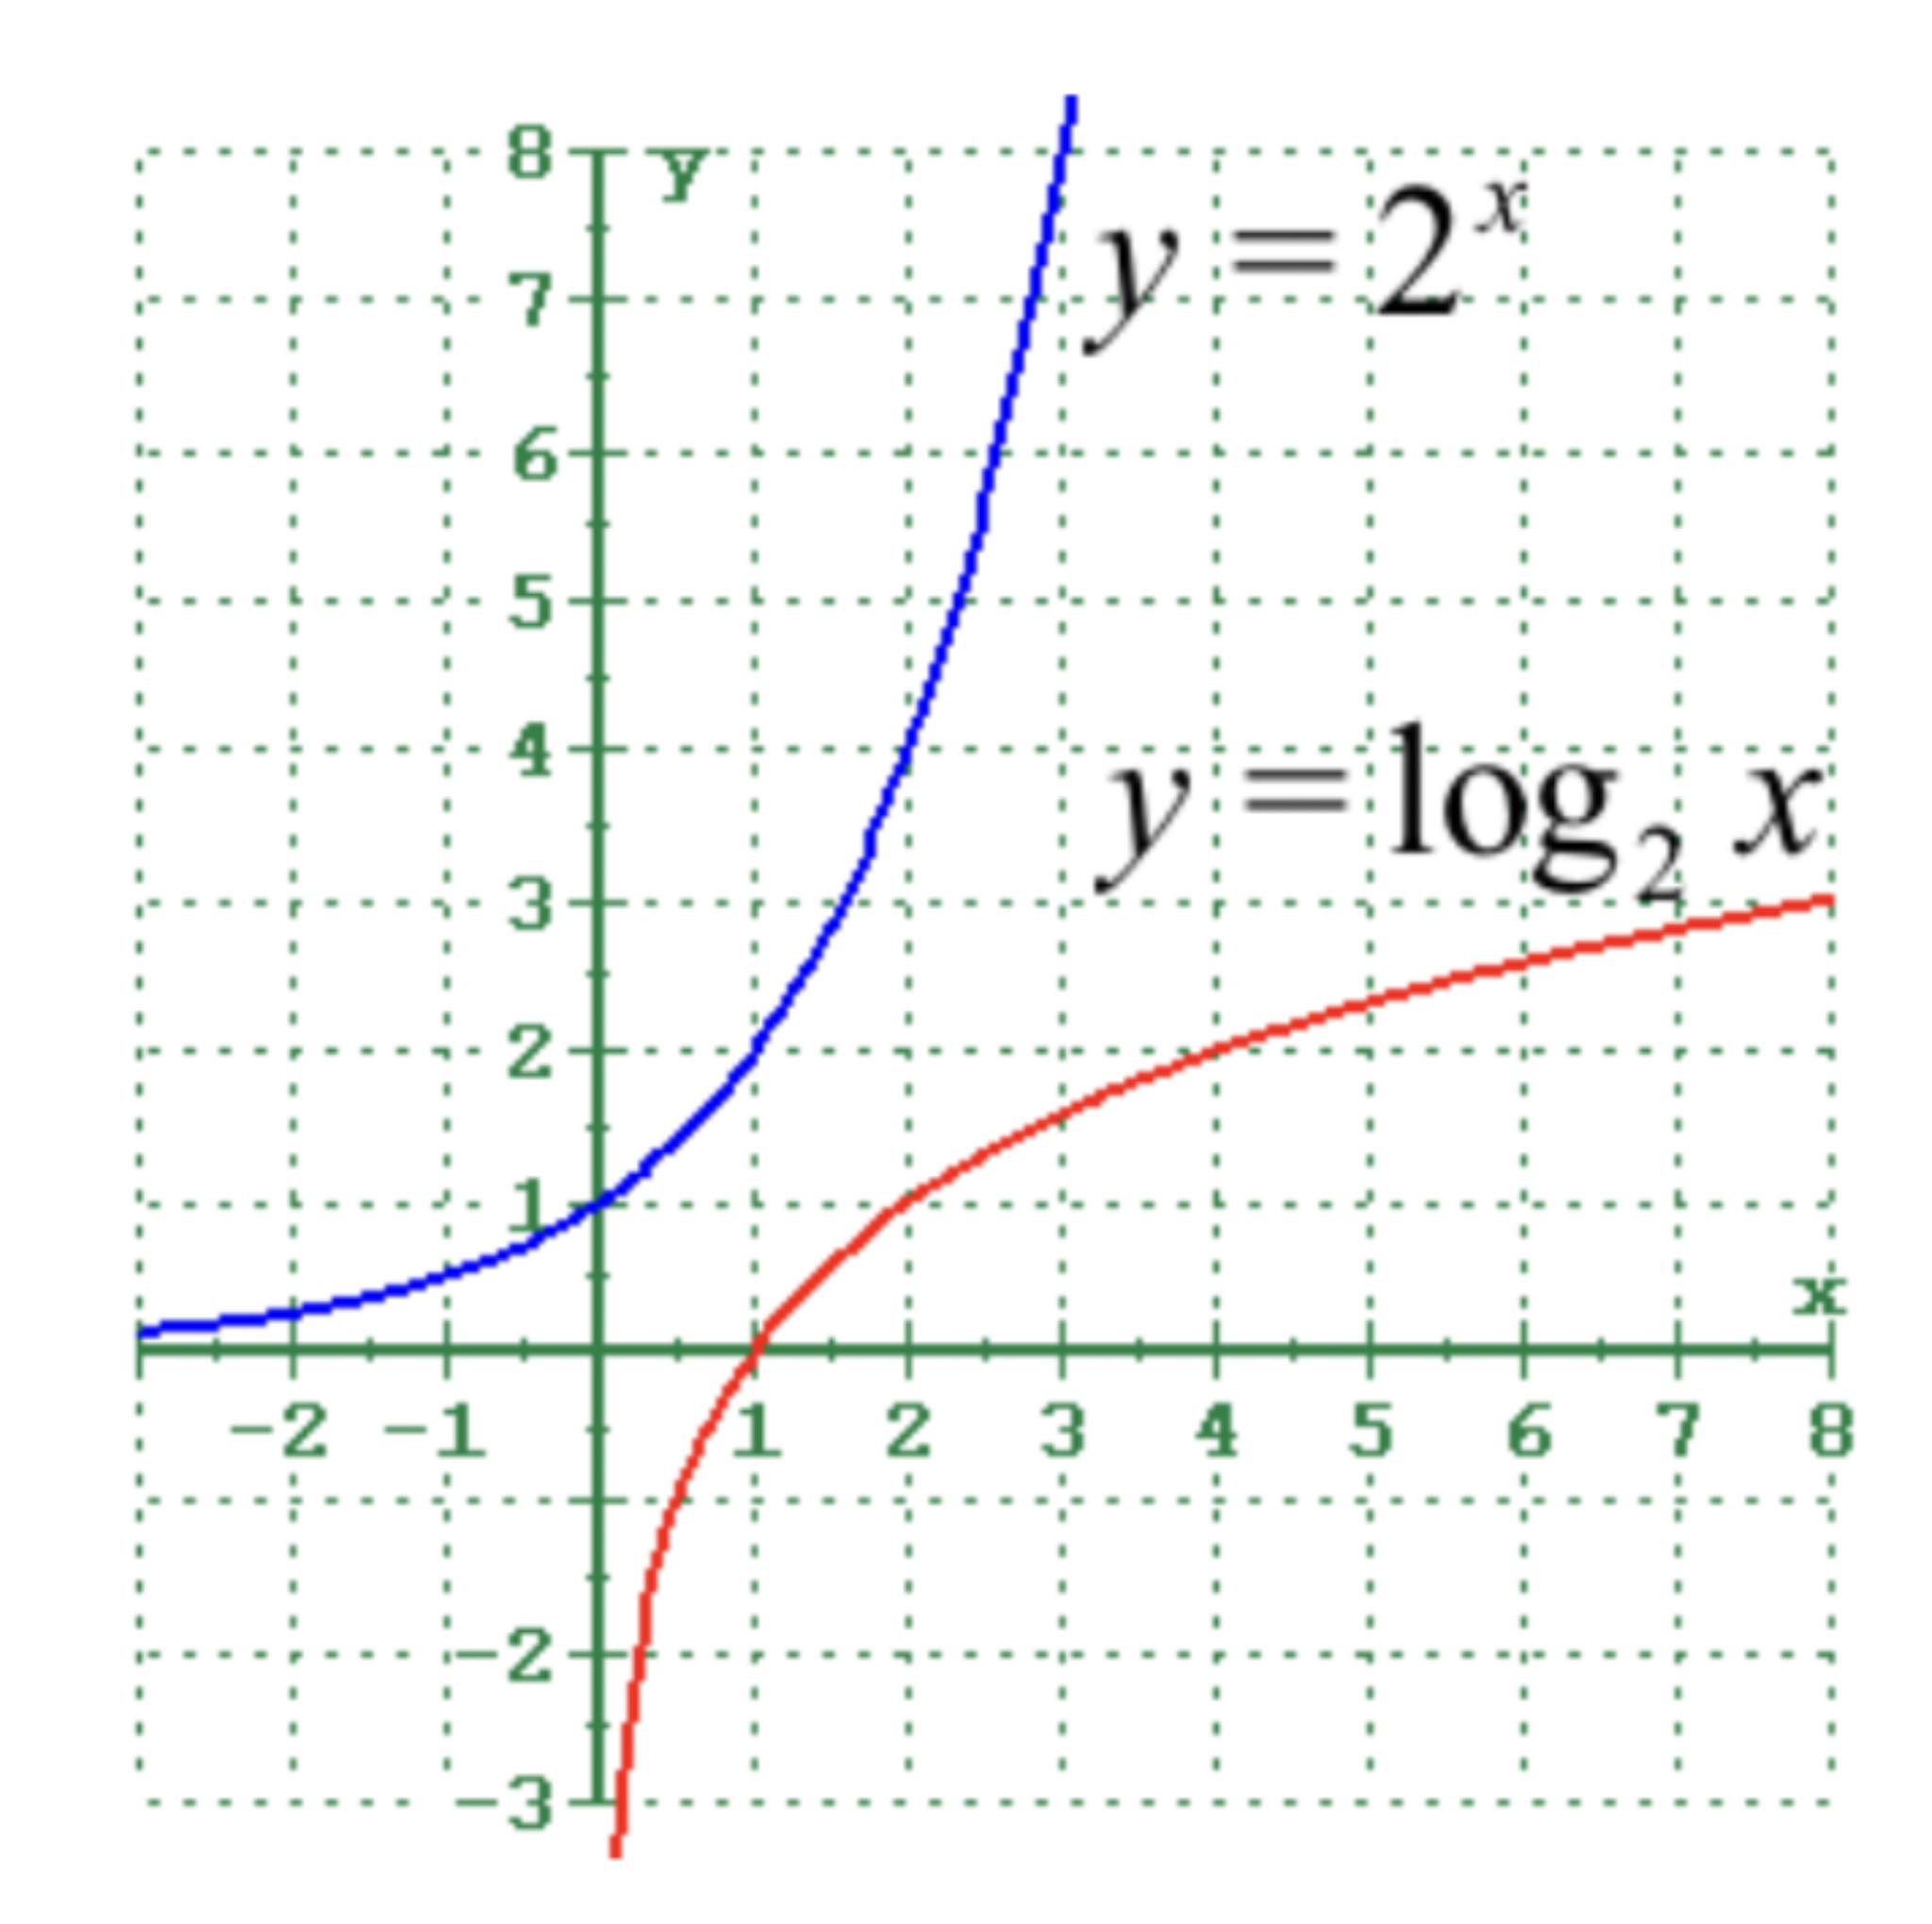
Even the total cases over time is not exponential it is logarithmic which can be mistaken for exponential in the beginning of an infection, but it always levels off which makes it logarithmic.


So again, who isn’t educated?


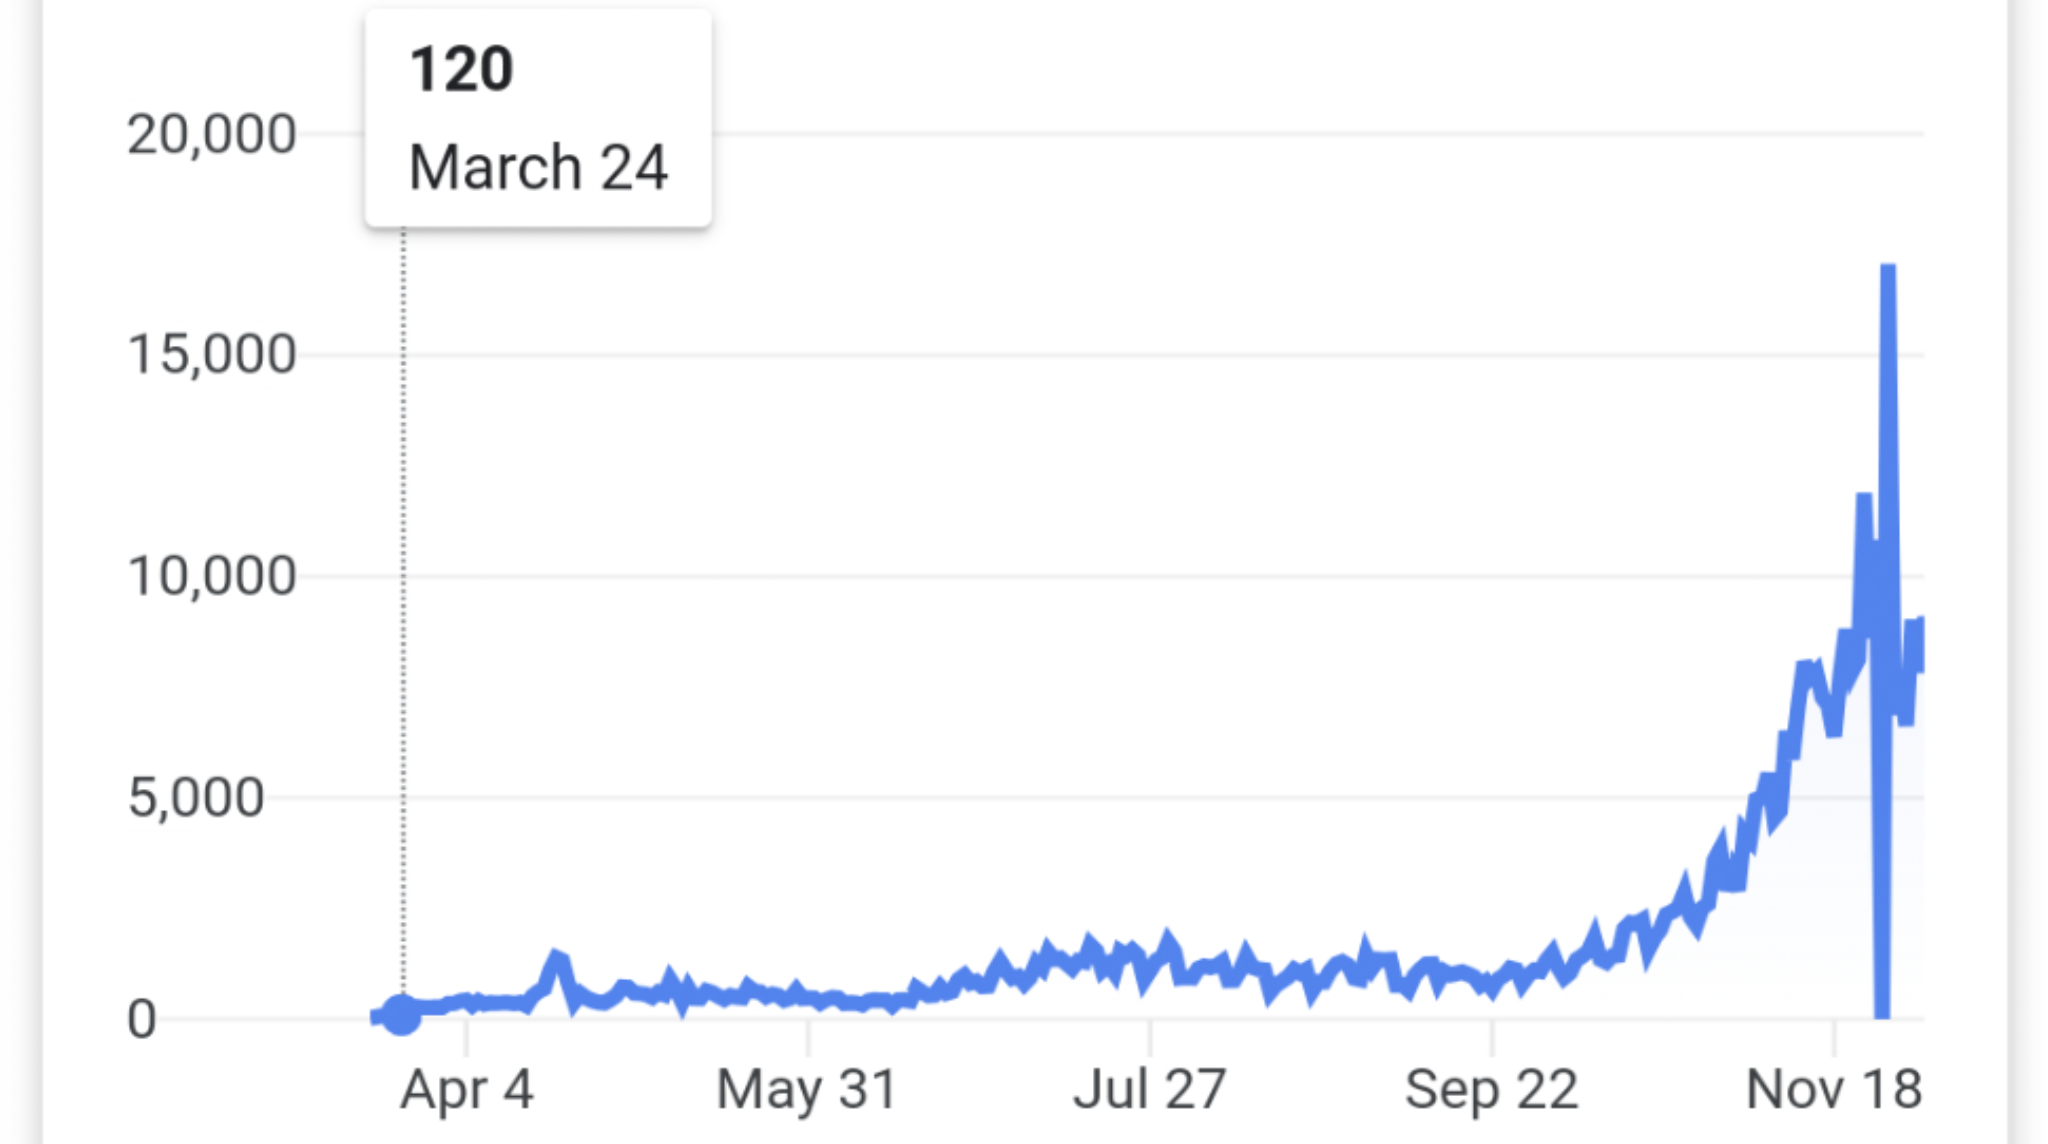
I have provided you with a graph of Covid, as well as definitions of exponential growth and logarithmic growth. Stevie Wonder could see that this wave is growing exponentially.

jmog Senior Member
7,737 posts 50 reps Joined Nov 2009
Sat, Dec 5, 2020 12:02 AM
posted by queencitybuckeye

The mask usage where the spread is happening is not 95%, not 9%. It's private get-togethers, mask usage effectively 0%.

Good God, it doesn’t spread at such anecdotal or even fictional places unless someone got it from outside that meeting where most are wearing masks.


jmog Senior Member
7,737 posts 50 reps Joined Nov 2009
Sat, Dec 5, 2020 12:07 AM
posted by Al Bundy

I have provided you with a graph of Covid, as well as definitions of exponential growth and logarithmic growth. Stevie Wonder could see that this wave is growing exponentially.

Please show me which of the cases per day or the deaths per day from this real source/website you believe to be exponential?


Look up normal distribution and merge a normal distribution for each wave and you have an approximate model.


What graph is that you provided, from one small town?


jmog Senior Member
7,737 posts 50 reps Joined Nov 2009
Sat, Dec 5, 2020 12:15 AM

I made a mistake earlier. 


I meant the daily counts were waves of normal distributions while the totals were LOGISTIC growths, not logarithmic growths.


Been a few years since I taught the calculus models for microbiology population growths. It is logistic not logarithmic. 


Al Bundy Senior Member
4,526 posts 40 reps Joined Nov 2009
Sat, Dec 5, 2020 1:37 AM
posted by jmog

Please show me which of the cases per day or the deaths per day from this real source/website you believe to be exponential?


Look up normal distribution and merge a normal distribution for each wave and you have an approximate model.


What graph is that you provided, from one small town?


I showed you the daily ohio numbers graph. It may turn logistic in 2021 (hopefully it does, or better yet decreases ), but it has been exponential growth in 2020.

If it were currently a logistic graph, we would be approaching a horizontal asymptote which would be our limit.


Al Bundy Senior Member
4,526 posts 40 reps Joined Nov 2009
Sat, Dec 5, 2020 1:54 AM
posted by jmog

I made a mistake earlier. 


I meant the daily counts were waves of normal distributions while the totals were LOGISTIC growths, not logarithmic growths.


Been a few years since I taught the calculus models for microbiology population growths. It is logistic not logarithmic. 


jmog, the article below explains how people who do not understand exponential growth tend to not understand the importance of masks. It also explains how many people confused the growth for logistic. The article could be describing you.


https://www.bbc.com/future/article/20200812-exponential-growth-bias-the-numerical-error-behind-covid-19

Dr Winston O'Boogie Senior Member
3,345 posts 35 reps Joined Oct 2010
Sat, Dec 5, 2020 8:57 AM

The humble bragging here is growing exponentially AND logistically AND obnoxiously. 

queencitybuckeye Senior Member
8,068 posts 120 reps Joined Nov 2009
Sat, Dec 5, 2020 9:38 AM
posted by jmog

Good God, it doesn’t spread at such anecdotal or even fictional places unless someone got it from outside that meeting where most are wearing masks.


Do you really not understand the basic logical flaw in your argument?

jmog Senior Member
7,737 posts 50 reps Joined Nov 2009
Sat, Dec 5, 2020 10:36 AM
posted by Al Bundy

I showed you the daily ohio numbers graph. It may turn logistic in 2021 (hopefully it does, or better yet decreases ), but it has been exponential growth in 2020.

If it were currently a logistic graph, we would be approaching a horizontal asymptote which would be our limit.


It doesn’t change from one to the other, it is either one or the other now. It is a logistic growth, as is every single total case graph pretty much ever for any infectious disease.


jmog Senior Member
7,737 posts 50 reps Joined Nov 2009
Sat, Dec 5, 2020 10:41 AM
posted by Al Bundy

jmog, the article below explains how people who do not understand exponential growth tend to not understand the importance of masks. It also explains how many people confused the growth for logistic. The article could be describing you.


https://www.bbc.com/future/article/20200812-exponential-growth-bias-the-numerical-error-behind-covid-19

Read the whole article, I don’t even want to comment how wrong it is as it will truly come across as bragging.


They are right that untrained people don’t understand exponential growth.


They are wrong that people in fields like mathematics, engineering, etc who are highly trained in math don’t understand exponential growth.


Al Bundy Senior Member
4,526 posts 40 reps Joined Nov 2009
Sat, Dec 5, 2020 12:02 PM
posted by jmog

It doesn’t change from one to the other, it is either one or the other now. It is a logistic growth, as is every single total case graph pretty much ever for any infectious disease.


A logistic model would level off and approach a limit. If the vaccine (or herd immunity) is effective. That is not what will happen here. The numbers will decrease and hopefully get to 0 or close to it. 

Another way that you could look at the numbers for this year would be the following. A logistic equation is concave down (think second derivative test), but our graph for this year is concave up.

Thank goodness that school doesn't let you teach calculus anymore. 

jmog Senior Member
7,737 posts 50 reps Joined Nov 2009
Sat, Dec 5, 2020 6:11 PM
posted by Al Bundy

A logistic model would level off and approach a limit. If the vaccine (or herd immunity) is effective. That is not what will happen here. The numbers will decrease and hopefully get to 0 or close to it. 

Another way that you could look at the numbers for this year would be the following. A logistic equation is concave down (think second derivative test), but our graph for this year is concave up.

Thank goodness that school doesn't let you teach calculus anymore. 

Maybe you didn’t read my post?


I said cases per day and deaths per day would be hybrid normal distribution models, which do end up at zero.


I said total cases and total deaths would end up at an asymptote, or “level off”.


Learn to read before you criticize someone else’s math knowledge and prove yourself wrong.


Al Bundy Senior Member
4,526 posts 40 reps Joined Nov 2009
Sat, Dec 5, 2020 7:37 PM
posted by jmog

Maybe you didn’t read my post?


I said cases per day and deaths per day would be hybrid normal distribution models, which do end up at zero.


I said total cases and total deaths would end up at an asymptote, or “level off”.


Learn to read before you criticize someone else’s math knowledge and prove yourself wrong.


You've been all over the place, and you have been wrong every time. 

Do you know what a normal distribution is (think symmetric bell shaped curve)? That has not been the graph in Ohio. Ohio has been exponential. If we were normal, we would be back to the low numbers of the beginning. Other states have had different graphs. New York state has been parabolic. Do you know what a parabola is?

friendfromlowry Senior Member
7,778 posts 86 reps Joined Nov 2009
Sat, Dec 5, 2020 7:49 PM

sportchampps Senior Member
7,527 posts 36 reps Joined Nov 2009
Sat, Dec 5, 2020 11:11 PM

Login

Register

Already have an account? Login